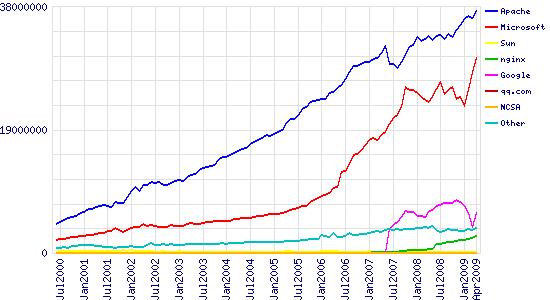
Totals for Active Servers Across All Domains
June 2000 – April 2009

| Developer | March 2009 | Percent | April 2009 | Percent | Change |
|---|---|---|---|---|---|
| Apache | 36,243,694 | 48.89% | 37,268,162 | 46.52% | -2.38 |
| Microsoft | 27,854,444 | 37.57% | 30,116,432 | 37.59% | 0.02 |
| 4,050,030 | 5.46% | 6,131,966 | 7.65% | 2.19 | |
| nginx | 2,303,451 | 3.11% | 2,602,109 | 3.25% | 0.14 |
| qq.com | 46,048 | 0.06% | 0 | 0.00% | -0.06 |
For more information on active servers, see Active Sites.
Market Share for Top Servers Across the Million Busiest Sites
September 2008 – April 2009
| Developer | March 2009 | Percent | April 2009 | Percent | Change |
|---|---|---|---|---|---|
| Apache | 666,485 | 67.90% | 663,649 | 67.56% | -0.34 |
| Microsoft | 186,827 | 19.03% | 185,763 | 18.91% | -0.12 |
| nginx | 30,642 | 3.12% | 31,064 | 3.16% | 0.04 |
| 15,594 | 1.59% | 16,088 | 1.64% | 0.05 |
For more information, see Million Busiest Websites.