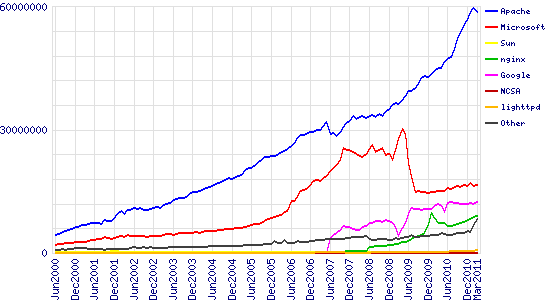
Totals for Active Servers Across All Domains
June 2000 – March 2011

| Developer | February 2011 | Percent | March 2011 | Percent | Change |
|---|---|---|---|---|---|
| Apache | 59,595,889 | 57.35% | 58,570,429 | 55.50% | -1.85 |
| Microsoft | 16,359,585 | 15.74% | 16,626,766 | 15.76% | 0.01 |
| 11,946,570 | 11.50% | 12,390,167 | 11.74% | 0.24 | |
| nginx | 8,688,338 | 8.36% | 8,946,787 | 8.48% | 0.12 |
| lighttpd | 598,339 | 0.58% | 624,988 | 0.59% | 0.02 |
For more information on active servers, see Active Sites
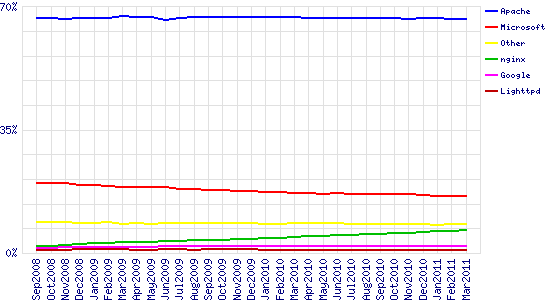
Market Share for Top Servers Across the Million Busiest Sites
September 2008 – March 2011

| Developer | February 2011 | Percent | March 2011 | Percent | Change |
|---|---|---|---|---|---|
| Apache | 660,238 | 66.42% | 659,369 | 66.32% | -0.09 |
| Microsoft | 161,189 | 16.21% | 160,069 | 16.10% | -0.11 |
| nginx | 62,762 | 6.31% | 64,221 | 6.46% | 0.15 |
| 19,422 | 1.95% | 21,099 | 2.12% | 0.17 |