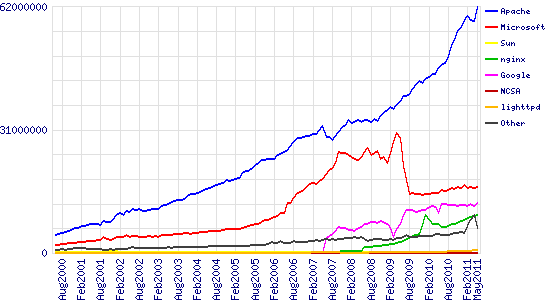
Totals for Active Servers Across All Domains
June 2000 – May 2011

| Developer | April 2011 | Percent | May 2011 | Percent | Change |
|---|---|---|---|---|---|
| Apache | 58,382,787 | 55.12% | 61,961,645 | 57.52% | 2.40 |
| Microsoft | 16,333,388 | 15.42% | 16,598,468 | 15.41% | -0.01 |
| 11,892,939 | 11.23% | 12,651,775 | 11.75% | 0.52 | |
| nginx | 9,192,405 | 8.68% | 9,499,307 | 8.82% | 0.14 |
| lighttpd | 660,001 | 0.62% | 678,076 | 0.63% | 0.01 |
For more information on active servers, see Active Sites
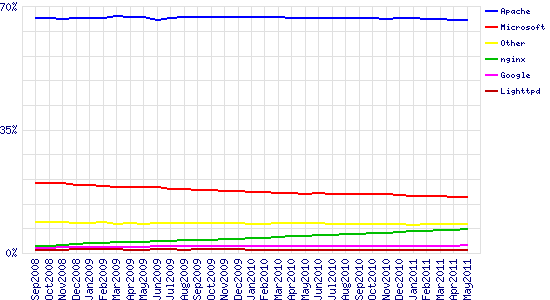
Market Share for Top Servers Across the Million Busiest Sites
September 2008 – May 2011

| Developer | April 2011 | Percent | May 2011 | Percent | Change |
|---|---|---|---|---|---|
| Apache | 657,920 | 66.17% | 656,953 | 66.08% | -0.09 |
| Microsoft | 159,173 | 16.01% | 157,795 | 15.87% | -0.14 |
| nginx | 64,871 | 6.52% | 67,478 | 6.79% | 0.26 |
| 21,057 | 2.12% | 21,268 | 2.14% | 0.02 |