Totals for Active Sites Across All Domains
June 2000 – May 2012
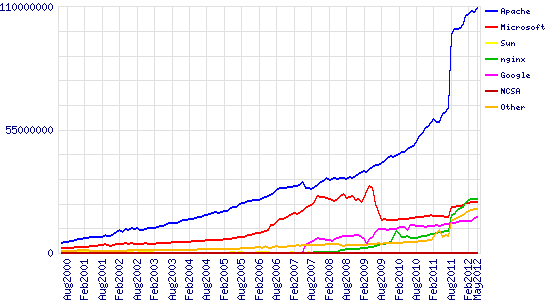
| Developer | April 2012 | Percent | May 2012 | Percent | Change |
|---|---|---|---|---|---|
| Apache | 107,686,403 | 56.66% | 109,278,620 | 57.02% | 0.36 |
| nginx | 24,253,806 | 12.76% | 23,938,754 | 12.49% | -0.27 |
| Microsoft | 22,813,215 | 12.00% | 22,803,442 | 11.90% | -0.10 |
| 15,671,026 | 8.25% | 15,855,806 | 8.27% | 0.03 |
For more information see Active Sites
Market Share for Top Servers Across the Million Busiest Sites
September 2008 – May 2012
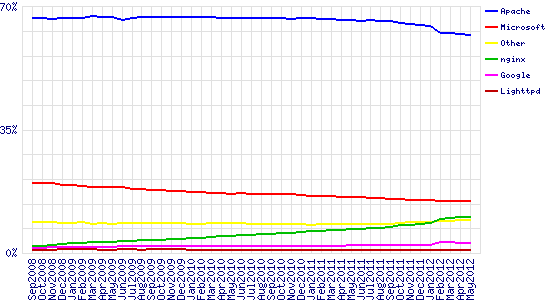
| Developer | April 2012 | Percent | May 2012 | Percent | Change |
|---|---|---|---|---|---|
| Apache | 618,001 | 62.08% | 617,430 | 62.02% | -0.06 |
| Microsoft | 148,171 | 14.89% | 146,974 | 14.76% | -0.12 |
| nginx | 100,394 | 10.09% | 100,417 | 10.09% | 0.00 |
| 28,773 | 2.89% | 29,071 | 2.92% | 0.03 |